Brisbane property market update May 2026: what three rate hikes and a sub-50% clearance rate mean for investors
Every month PropTalk breaks down the latest Brisbane property data so investors can separate signal from noise. May 2026 brings three consecutive RBA rate hikes, clearance rates below 50% for the first time in years, and decelerating monthly growth. Here is what every data point actually means and the practical framework for what to do about it.
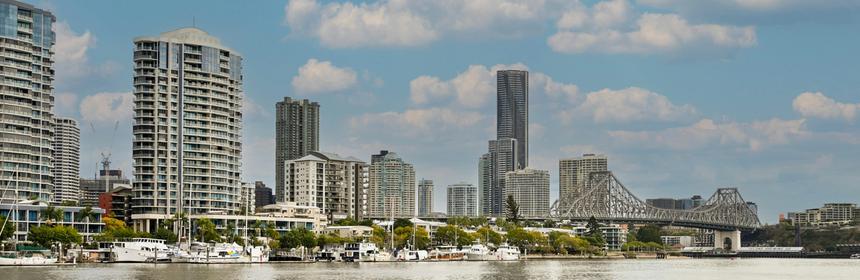
Something has shifted in Brisbane's property market in May 2026, and investors are noticing. The auction clearance rate dropped below 50% in the most recent week a level that by long-run benchmarks sits firmly in buyer-favourable territory. Monthly value growth decelerated from 1.8% in March to 1.2% in April. The RBA has now raised rates three times in 2026, returning the cash rate to 4.35% and fully reversing last year's cuts. And the Federal Budget's negative gearing changes have introduced uncertainty that has visibly dented sentiment at auction.
But here is the critical distinction. Slowing is not the same as reversing. Moderating is not the same as crashing. And Brisbane's fundamentals tight supply, strong population growth, below-average listing volumes and a 19.7% annual growth rate are all structurally different from the conditions that historically precede a genuine correction. This article breaks down every data signal, separates the noise from the signal, and gives you a clear framework for what to do next.
Reading the signals what each data point actually means
Brisbane's market is generating mixed signals in May 2026 and it is important to read each one correctly rather than treating all negative indicators as equally alarming or all positive indicators as confirmation that nothing has changed. Here is an honest assessment of each key metric.
Clearance rate at 48.8% buyers gaining leverage at auction
A clearance rate below 50% means more properties are passing in at auction than selling under the hammer. The high number of passed-in results suggests vendors and buyers cannot agree on price at the auction stage. This is the clearest early signal that buyer sentiment has softened materially. By long-run benchmarks, anything below 60% is buyer-favourable territory.
48.8% most recent week, vs 72% cyclical peak in Sep 2025Three consecutive RBA hikes borrowing capacity squeezed
The RBA raised rates in February, March and May 2026, returning the cash rate to 4.35% and fully reversing last year's three cuts. Each 25bp rise reduces borrowing capacity by approximately $15,000 to $20,000 for a median income borrower. Three consecutive rises reduce borrowing capacity by $45,000 to $60,000 a meaningful constraint on the buyer pool for properties above $1 million.
4.35% cash rate investor variable rate approximately 5.91%Monthly growth decelerating the pace is slowing
Brisbane's monthly growth rate decelerated from 1.8% in March 2026 to 1.2% in April 2026. While 1.2% monthly growth remains strong by any historical standard, the direction of travel matters. Cotality's rolling 28-day data shows Brisbane's growth rate has been easing since late 2025, reflecting the cumulative impact of affordability constraints and rate rises on buyer capacity.
1.2% in April down from 1.8% in March and 1.7% in FebruaryAnnual growth at 19.7% still one of Australia's strongest markets
Despite the monthly deceleration, Brisbane's annual growth rate of 19.7% to April 2026 remains the second strongest of any Australian capital city. Values are at a fresh peak. The five-year growth of 84% and ten-year growth of 119.5% reflect structural demand that does not evaporate in a single quarter. Annual growth above 15% during a period of rising rates is historically unusual and reflects Brisbane's specific supply-demand imbalance.
+19.7% annual only Perth (+26.0%) outperformed nationallyListings still below five-year average supply supporting prices
Total advertised stock in Brisbane is tracking approximately 13.7% below year-ago levels and well below the five-year average. While new listings have increased 35.4% year on year, the rate of absorption has kept total stock low. Low supply is the single strongest structural support for Brisbane prices in any rate environment which limits the ability of falling buyer sentiment to translate into falling prices.
Total listings -13.7% year on year supply remains tightRental vacancy at 0.8% rental market remains critically tight
Brisbane's vacancy rate tightened to 0.8% in April 2026, matching Adelaide as the equal tightest of any east-coast capital. Annual rent growth of 6.4% to 6.7% means rental income is growing at a meaningful pace. For investors, a tightening rental market during a period of slower price growth is actually a positive development it improves yield and reduces vacancy risk simultaneously.
0.8% vacancy annual rent growth of +6.4% to +6.7%Budget changes creating investor uncertainty
The Federal Budget confirmed on 12 May 2026 has introduced a layer of uncertainty around investment strategy that is visibly affecting auction sentiment. The clearance rate dropped to its year-to-date low in the week immediately following the budget announcement. Some of this is temporary sentiment disruption as investors recalibrate. The structural impact of ring-fenced losses from July 2027 will take time to fully manifest in transaction volumes.
Clearance rate hit year-to-date low week of 12 May 2026Days on market rising slightly buyers taking more time
The median days on market in Brisbane increased from 20 days in April 2025 to 18 days in April 2026 still faster than the year prior but the trend within 2026 shows selling times rising through the early months of the year. This reflects buyers taking more time and conducting more due diligence rather than making urgency-driven decisions. It is a normalisation signal rather than a distress signal at current levels.
18 days median up from the cycle trough of approximately 14 daysHow Brisbane compares to the national picture
The Brisbane slowdown narrative becomes more nuanced when placed in national context. Brisbane is not just slowing. It is slowing from an exceptional pace while remaining one of Australia's two or three strongest markets. The difference between Brisbane and the other major capitals in 2026 is not that Brisbane is softening. It is that Sydney and Melbourne are actively declining while Brisbane continues to grow.
| Capital city | Monthly change | Annual change | Quarterly change | Direction |
|---|---|---|---|---|
| Brisbane | +1.2% | +19.7% | +4.7% | Growing, moderating |
| Perth | +2.1% | +26.0% | +6.8% | Growing strong |
| Adelaide | +1.1% | +12.2% | +3.5% | Growing steady |
| Sydney | -0.6% | +4.2% | -0.9% | Declining |
| Melbourne | -0.6% | +2.0% | -1.5% | Declining |
| Hobart | +0.2% | +8.5% | +2.6% | Growing slowly |
The comparison makes Brisbane's position clear. A 1.2% monthly gain in a period of three consecutive rate rises, against a national backdrop where Sydney and Melbourne are both declining, is not a sign of a market under stress. It is a sign of a market with structural demand that is absorbing rate rises better than the more highly leveraged, lower-yield southern capitals.
Australia's combined capital cities housing market has navigated ten downturns where home values fell over at least a three-month period in the past 40 years. The most significant was 2017 to 2019 when values fell 8.2% over 19 months. Brisbane's current growth rate of 19.7% annually, even while moderating, is not consistent with the conditions that have historically preceded a genuine correction. Those corrections were characterised by sustained monthly declines, not decelerating monthly gains.
What history tells us about periods like this one
Brisbane has experienced multiple cycles of rapid growth followed by moderation over the past two decades. The pattern is consistent: strong growth attracts investment, investment drives affordability limits, affordability limits trigger rate-sensitive caution, and the market consolidates before the next growth phase. Understanding where in this cycle Brisbane sits in May 2026 is more valuable than reacting to the week's auction results.
The 2022 to 2023 analogue
The most instructive comparison is 2022 to 2023. The RBA raised rates from 0.10% to 4.35% in 13 months the fastest and largest tightening cycle in Australian history. Brisbane values fell 3.3% from their 2022 peak to the 2023 trough, before recovering and reaching new highs. The current cycle involves a much smaller rate move from 3.60% to 4.35% over three months starting from a position of already high prices but also a more undersupplied market than 2022. The conditions for a 2022-style correction do not currently exist in Brisbane's data.
"Slowing is not the same as reversing. Moderating is not the same as crashing. Brisbane's fundamentals are structurally different from the conditions that historically precede a genuine correction."
PropTalk Analysis May 2026What would actually signal a genuine correction risk
Investors should monitor these specific indicators rather than reacting to clearance rate volatility or monthly growth fluctuations. A genuine correction risk in Brisbane would require a combination of several of these simultaneously not just one or two in isolation.
Sustained monthly price declines across two or more consecutive months. Total listings rising above the five-year average currently 13.7% below it. Days on market exceeding 30 days as a consistent trend rather than a single week reading. Vacancy rate rising above 1.5% as supply catches up to rental demand. Unemployment rising above 5% in Queensland reducing household capacity to service debt. None of these conditions currently exist in Brisbane's data as at May 2026.
What this means for investors making decisions now
The practical question for first-time investors is not whether Brisbane is slowing down. It clearly is, at the margin. The question is whether the slowdown changes the investment case materially enough to affect a ten-year hold decision. The honest answer is no, with two important qualifications.
Every significant moderation in Brisbane's property market has been followed by a resumption of growth. Investors who entered during the 2022 to 2023 softening period, when clearance rates were falling and sentiment was negative captured the best entry prices of the recent cycle. A moderating market with strong fundamentals is not a signal to retreat. It is the environment where prepared buyers with pre-approved finance and clear suburb selection criteria find the best opportunities.
Brisbane is moderating, not correcting. The fundamentals remain intact. Prepared buyers gain negotiating power they have not had in two years.
The data as at May 2026 tells a nuanced story. Clearance rates below 50%, three rate rises, and decelerating monthly growth are genuine signals of a softening market. But Brisbane's annual growth of 19.7%, vacancy at 0.8%, listings below the five-year average, and population growth outpacing supply are structural supports that distinguish this moderation from the conditions that precede genuine corrections. For investors, the current environment is not a signal to retreat it is a signal to prepare more carefully, negotiate more assertively, model cash flow at current rates without assuming relief, and focus on suburbs where supply constraints will support value through any cycle. The Brisbane property investment case is not over. It is entering a more selective phase.
Data sources: Cotality Home Value Index April 2026 monthly, quarterly and annual growth figures, median values, days on market; Cotality Monthly Housing Chart Pack May 2026 clearance rates, listings data, vendor discount, rental vacancy; OpenAgent Brisbane property market data using Cotality data (May 2026); API Magazine Brisbane property market analysis (May 2026); Dr Andrew Wilson National Weekly Auction Report 23 May 2026; PropertyUpdate.com.au Australian Property Market Update 23 May 2026; Centre for Population population projections 2026. All figures are indicative based on publicly available data at the date of publication. This article is for general informational purposes only and does not constitute financial or investment advice. Always verify current data and consult a licensed financial adviser before making investment decisions.