Ipswich property investment guide 2026: Springfield Lakes, Ripley, Redbank Plains and Goodna
Most Ipswich investment guides present a single scenario and call it the investment case. This one presents four: established house, established unit, new build house, and new build unit. The difference matters significantly. An established house in Springfield Lakes costs $334 per week to hold today but $542 per week from July 2027 when post-budget ring-fencing applies. A new build unit in the same suburb costs $228 per week today and stays at $228 after July 2027. Knowing which scenario applies to your purchase is not optional , it changes the entire financial model.
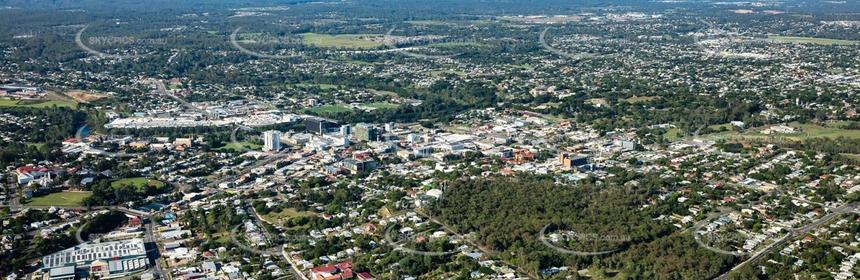
Ipswich sits at an interesting intersection in Brisbane's property market in 2026. It is close enough to Brisbane to benefit from the city's structural supply shortage and population growth, but far enough out to offer entry prices that are still accessible to investors who have been priced out of the inner and middle ring. The four suburbs in this guide , Springfield Lakes, Ripley, Redbank Plains and Goodna , each tell a slightly different story within the Ipswich corridor, and understanding those differences is more useful than a single LGA-level assessment.
Ipswich should not be viewed as a uniform investment market. Performance varies significantly by suburb, asset type and supply conditions, and a broad LGA-level assessment masks important differences between established suburbs, master-planned corridors and outer pockets. The four suburbs in this guide represent distinct positions within that spectrum.
The structure of this guide is deliberate. Every suburb profile presents all four investment scenarios side by side: established house, established unit, new build house, and new build unit. Comparing a new build unit directly to an established house is not an honest comparison because the two assets have different prices, different tax treatments and different risk profiles. A fair analysis compares like with like and lets investors see all four options clearly before deciding which scenario suits their situation.
Each suburb has a four-column scenario table. Established House and Established Unit show the current holding cost plus the post-July 2027 cost once negative gearing ring-fencing applies to properties purchased after 12 May 2026. New Build House and New Build Unit retain full negative gearing under the announced policy settings and the holding cost does not change after July 2027. All tax benefit calculations assume a 34.5% marginal rate. Depreciation on established properties assumes Division 43 only. New build depreciation includes both Division 43 and estimated Division 40. All figures are before mortgage principal repayment , this is the true cash cost of holding the property each week.
Ipswich market snapshot 2026
| Metric | Houses | Units |
|---|---|---|
| Median price | $813,500 | $443,500 |
| Annual growth | +3.3% | -7.1% (6 sales only) |
| Weekly rent | $550/wk | $388/wk |
| Annual rent growth | +6.8% | +7.8% |
| Gross yield | 3.52% | 4.55% |
Source: realestate.com.au Greater Region dataset May 2026. Figures may vary depending on data provider and geographic scope. Unit figures based on thin transaction sample , treat with caution.
Ipswich city at a glance
| Metric | Houses | Units | Notes |
|---|---|---|---|
| Median price | $813,500 | $443,500 | realestate.com.au May 2026 |
| Annual growth | +3.3% | -7.1% | Unit figure based on thin sample , see note below |
| Weekly rent | $550/wk | $388/wk | realestate.com.au May 2026 |
| Rent growth | +6.8% | +7.8% | Annual |
| Gross yield (house) | 3.52% | 4.55% | Annual rent divided by median price |
Figures are based on realestate.com.au Ipswich Greater Region dataset and may vary depending on data provider and geographic scope. Individual suburb figures are based on more transactions and should be considered more reliable for investment decision-making than LGA-level data.
The Ipswich city unit median of $443,500 showing a -7.1% annual decline is a genuine realestate.com.au figure but it should be interpreted carefully. The Ipswich city unit market is extremely thin , realestate.com.au shows the $443,500 median is based on just 6 sales recorded between June 2025 and May 2026. A sample of 6 transactions is insufficient to draw reliable conclusions about the direction of the unit market. A single outlier sale can move the median by several percentage points in either direction. The individual suburb figures for Springfield Lakes, Ripley, Redbank Plains and Goodna , each based on more transactions , are more reliable for investment decision-making than the LGA-level figure.
House growth of 3.3% across the Ipswich LGA is lower than Brisbane's city-wide average of 19.7% and lower than the individual suburb figures for each of the four suburbs in this guide. This is partly a compositional effect , the LGA includes slower-growing pockets alongside faster-growing suburbs , and partly a reflection of Ipswich's position as a large and diverse council area where individual suburb dynamics vary considerably. The four suburbs in this guide all recorded house growth of 15.5% to 18.1%, which is substantially stronger than the LGA headline figure suggests.
Understanding Ipswich as three distinct submarkets
Investors approaching Ipswich for the first time often treat it as a single market. It is more useful to think of it as three distinct submarkets with different risk and return profiles.
Established suburbs, areas like Goodna, which have existing streetscapes, established amenity and constrained land supply , tend to offer more stable long-term growth driven by genuine scarcity rather than new release activity. Supply risk is lower and tenant demand is anchored to multiple employment sources. Goodna's proximity to Brisbane rail adds a further demand driver that master-planned outer suburbs cannot replicate.
Master-planned communities , Springfield Lakes and Ripley , offer strong infrastructure investment and growing amenity but carry a meaningful supply risk. Large land pipelines in these corridors mean that developer activity can add significant new dwelling stock relatively quickly. In strong market conditions that supply is absorbed. In softer conditions it can weigh on prices and rents more than in established suburbs. Investors in master-planned corridors should take a longer investment horizon and assess the remaining land release pipeline before committing.
Affordable outer suburbs, such as Redbank Plains , typically offer slightly higher yields relative to price but may carry more volatility as the market's liquidity at these price points is thinner. The moderate 3.95% gross yield at Redbank Plains reflects a balanced growth and income profile rather than an exceptional cash flow position.
Four suburbs in detail
| Metric | Est. House | Est. Unit | New Build House | New Build Unit |
|---|---|---|---|---|
| Purchase price | $920,500 | $735,000 | $920,500 | $735,000 |
| Deposit (20%) | $184,100 | $147,000 | $184,100 | $147,000 |
| Stamp duty | $41,524 | $32,712 | $41,524 | $32,712 |
| Total upfront | $228,274 | $182,362 | $228,274 | $182,362 |
| Weekly mortgage | $1,009/wk | $806/wk | $1,009/wk | $806/wk |
| Weekly rent received | $660/wk | $600/wk | $660/wk | $600/wk |
| Gross yield | 3.73% | 4.24% | 3.73% | 4.24% |
| Annual depreciation | $9,205 | $5,512 | $13,356 | $8,431 |
| True weekly cost (now) | $334/wk | $275/wk | $272/wk | $228/wk |
| True weekly cost (post Jul 2027) | $542/wk | $439/wk | $272/wk | $228/wk |
Springfield Lakes is the most established and infrastructure-rich suburb in the Ipswich investment corridor. The master-planned community centred on Springfield Central station (opened December 2013, approximately 30 kilometres from Brisbane Central by rail), USC Springfield university campus, Orion Shopping Centre and Mater Private Hospital Springfield has developed into a genuine self-contained urban centre rather than a dormitory suburb. That distinction matters for investors because it supports rental demand from a broader tenant profile including healthcare workers, university staff and students, and professionals who work within the Springfield precinct itself rather than commuting to Brisbane CBD.
The four-scenario comparison reveals the post-budget tax change in stark terms. An established house purchased after 12 May 2026 costs $334 per week to hold today, but that figure rises to $542 per week from July 2027 when the negative gearing loss is ring-fenced and can no longer be offset against wages. That $208 per week increase in holding cost is the direct financial impact of the post-budget established property rule on a $920,500 Springfield Lakes house , a significant figure that must be modelled before purchase. A new build house at the same price costs $272 per week today and maintains that cost after July 2027.
Unit growth of 20.5% annually is the standout figure for Springfield Lakes. At $735,000 for established units and $600 per week rent, the 4.24% gross yield is the strongest of any property type in this suburb. The established unit post-July 2027 holding cost of $439 per week is still manageable relative to income for most investors at the 34.5% bracket, though substantially higher than the $275 per week current position.
| Metric | Est. House | Est. Unit | New Build House | New Build Unit |
|---|---|---|---|---|
| Purchase price | $875,000 | $730,000 | $875,000 | $730,000 |
| Deposit (20%) | $175,000 | $146,000 | $175,000 | $146,000 |
| Stamp duty | $39,362 | $32,475 | $39,362 | $32,475 |
| Total upfront | $217,012 | $181,125 | $217,012 | $181,125 |
| Weekly mortgage | $959/wk | $800/wk | $959/wk | $800/wk |
| Weekly rent received | $630/wk | $520/wk | $630/wk | $520/wk |
| Gross yield | 3.74% | 3.70% | 3.74% | 3.70% |
| Annual depreciation | $8,750 | $5,475 | $12,844 | $8,388 |
| True weekly cost (now) | $320/wk | $319/wk | $259/wk | $272/wk |
| True weekly cost (post Jul 2027) | $518/wk | $506/wk | $259/wk | $272/wk |
Ripley is the fastest-growing new land corridor within the Ipswich LGA. The suburb sits west of Springfield Lakes and is at an earlier stage of the master-planned development cycle, with major land releases and new dwelling construction ongoing across the valley. The Ripley Town Centre, which opened progressively from 2022, is the commercial and retail anchor for the corridor and has accelerated the suburb's evolution from a purely residential release into a more self-contained community.
The 31.5% annual unit growth figure for Ripley is the highest in this guide and requires context. Ripley's unit market is relatively new and thin , the 31.5% growth reflects a small sample of transactions in a developing market rather than the kind of sustained growth seen in an established suburb. It is a directional signal that unit values are moving strongly, but investors should not extrapolate that rate into long-term projections without understanding the sample size behind it.
Ripley is the one suburb in this guide where the established house and established unit holding costs are almost identical today , $320 and $319 per week respectively. That near-identical pre-July 2027 position changes dramatically after ring-fencing, where both rise to $518 and $506 per week. The post-July 2027 comparison between established property at $506 to $518 per week and new build at $259 to $272 per week is the starkest illustration of the post-budget tax impact in this guide.
| Metric | Est. House | Est. Unit | New Build House | New Build Unit |
|---|---|---|---|---|
| Purchase price | $825,500 | $659,000 | $825,500 | $659,000 |
| Deposit (20%) | $165,100 | $131,800 | $165,100 | $131,800 |
| Stamp duty | $37,011 | $29,102 | $37,011 | $29,102 |
| Total upfront | $204,761 | $163,552 | $204,761 | $163,552 |
| Weekly mortgage | $905/wk | $722/wk | $905/wk | $722/wk |
| Weekly rent received | $600/wk | $500/wk | $600/wk | $500/wk |
| Gross yield | 3.78% | 3.95% | 3.78% | 3.95% |
| Annual depreciation | $8,255 | $4,942 | $12,287 | $7,766 |
| True weekly cost (now) | $302/wk | $279/wk | $244/wk | $236/wk |
| True weekly cost (post Jul 2027) | $490/wk | $444/wk | $244/wk | $236/wk |
Redbank Plains offers the best balance of yield and entry price across the four suburbs in this guide. At $659,000 for units with a moderate 3.95% gross yield and unit rent growth of 8.7% annually, Redbank Plains units have the lowest total upfront cost of any scenario in this guide at $163,552 , making it the most accessible entry point for investors with a $160,000 to $180,000 savings base. The new build unit scenario at $236 per week holding cost is also the most manageable weekly figure of any new build unit across the four suburbs.
House growth of 17.9% and unit rent growth of 8.7% are both solid figures for a suburb at this price point. Redbank Plains benefits from its position between the Ipswich CBD to the west and the Springfield corridor to the east, with the Redbank Plains Town Centre providing established retail and commercial amenity. The suburb's tenant profile is largely families and tradespeople working in the Ipswich employment corridor, producing stable rental demand with relatively low vacancy.
The most notable feature of the Redbank Plains four-scenario comparison is how close the new build house and new build unit holding costs are , $244 versus $236 per week. For an investor who can afford either property type, the difference is small enough that the decision should be driven by growth trajectory and tenant demand rather than by weekly cost alone.
| Metric | Est. House | Est. Unit | New Build House | New Build Unit |
|---|---|---|---|---|
| Purchase price | $770,000 | $580,000 | $770,000 | $580,000 |
| Deposit (20%) | $154,000 | $116,000 | $154,000 | $116,000 |
| Stamp duty | $34,375 | $25,350 | $34,375 | $25,350 |
| Total upfront | $191,025 | $144,000 | $191,025 | $144,000 |
| Weekly mortgage | $844/wk | $636/wk | $844/wk | $636/wk |
| Weekly rent received | $580/wk | $475/wk | $580/wk | $475/wk |
| Gross yield | 3.92% | 4.26% | 3.92% | 4.26% |
| Annual depreciation | $7,700 | $4,350 | $11,662 | $7,075 |
| True weekly cost (now) | $274/wk | $236/wk | $219/wk | $196/wk |
| True weekly cost (post Jul 2027) | $446/wk | $376/wk | $219/wk | $196/wk |
Goodna is the closest suburb to Brisbane CBD in this guide at approximately 22 kilometres, sitting directly on the Ipswich railway line with regular services to Brisbane CBD. That location gives Goodna a materially different tenant profile to the other three suburbs , it attracts tenants who work in Brisbane but cannot afford inner-city rents, which produces consistent rental demand from a broad employment base rather than from a single local employer anchor.
Goodna produces the lowest absolute holding costs of any suburb in this guide across all four scenarios. A new build unit at $196 per week and a new build house at $219 per week are the most manageable weekly figures in the entire analysis. The established house at $274 per week today is also the lowest established house holding cost across the four suburbs, reflecting Goodna's lower median price of $770,000 relative to Springfield Lakes at $920,500.
Two figures in the Goodna data require a note. House rent growth of 9.4% annually is the strongest of the four suburbs and reflects genuine tenant demand driven by Brisbane commuter spillover. Unit rent growth of -2.1% is the one negative figure in the guide , a thin unit market sample means this figure should be treated cautiously rather than as a definitive signal that Goodna unit rents are declining. The $475 per week current unit rent is used in the calculations above as the confirmed realestate.com.au figure, but investors should verify current comparable rentals from a local property manager before relying on it.
Ipswich-specific risks investors should understand
No property guide for the Ipswich corridor is complete without a direct discussion of the risks that are specific to this market. These are not reasons to avoid Ipswich , they are factors that distinguish a well-informed purchase from an uninformed one.
Oversupply risk in master-planned corridors
Springfield Lakes and Ripley both sit within large master-planned communities with significant remaining land release pipelines. When developer activity is high and multiple new land stages are released simultaneously, new dwelling completions can temporarily exceed absorption capacity. This has historically produced softer rents and slower price growth in affected pockets until the population catch-up occurs. Investors in these corridors should research the remaining approved land supply and current developer activity before assuming historical growth rates will continue linearly.
Flood risk
Parts of the Ipswich LGA have significant flood history. The 2011 and 2022 flood events affected multiple Ipswich suburbs and resulted in meaningful property value impacts in the most affected areas. Before purchasing any Ipswich property, obtain a flood check from the Ipswich City Council and confirm the specific property's flood risk classification. Properties in designated flood-prone areas may face challenges with insurance costs, insurability, and resale liquidity. This is a non-negotiable due diligence step in the Ipswich market.
Yield compression and growth moderation
Ipswich experienced exceptional price growth from 2020 to 2024 as buyers priced out of Brisbane sought more affordable alternatives. Much of that initial affordability premium has now been absorbed. House growth of 3.3% across the LGA in the most recent 12-month period , compared to the 15% to 18% recorded in individual suburbs , reflects the market entering a more measured phase. Investors entering now should model returns on more conservative growth assumptions than the post-2020 boom period produced.
Across all four suburbs, the new build unit consistently produces the lowest weekly holding cost and the most stable post-July 2027 position. The established property scenarios , both house and unit , carry a material holding cost increase after July 2027 that must be modelled before purchase. The gap between established property post-July 2027 and new build is not marginal , in Springfield Lakes it is $314 per week for established houses versus new build units, and in Ripley it is $247 per week. That difference accumulates to $16,328 and $12,844 per year respectively , meaningful sums that change the fundamental investment case for each property type. Investors who understand this distinction and select accordingly will be in a materially different financial position from those who do not.
What should an Ipswich investor actually do in 2026?
The analysis in this guide points toward a clear practical framework for investors approaching the Ipswich corridor.
Focus on supply-constrained established areas first. Goodna and the established pockets of Redbank Plains offer lower supply risk and more stable long-term demand driven by Brisbane commuter proximity. The scarcity of available land in these areas limits the degree to which new development can compete directly with your investment.
Be cautious with high-supply master-planned estates. Springfield Lakes and Ripley both have genuine investment merits but also significant remaining land pipelines. If you purchase in these corridors, do so in the most established sections of the estate rather than in the newest outer releases, and stress-test your return assumptions against a scenario where rents grow more slowly than historical rates suggest.
Take a long investment horizon. Ipswich is not a short-term trade. The structural demand drivers , population growth, Brisbane displacement, infrastructure investment and improving amenity , play out over a 7 to 10 year minimum horizon. Investors who need to sell within 3 to 5 years should assess liquidity risk carefully, particularly for units in high-supply corridors.
Model all four scenarios before committing. The post-budget tax change means the scenario you choose , established or new build, house or unit , has a larger impact on your holding cost than which specific suburb you select. Do not make a suburb decision before you have modelled all four scenarios for your own tax position with your accountant.
Ipswich offers a credible investment case in certain scenarios in 2026 , but the scenario you choose matters more than the suburb you pick.
The four suburbs in this guide all have credible investment cases across house growth of 15.5% to 18.1% and unit growth of 14.8% to 31.5%. The differences between suburbs in terms of absolute holding cost, growth trajectory and tenant profile are real but manageable. The difference between scenarios , particularly between established property post-July 2027 and new build , is far larger than any suburb-level difference in this analysis. A Goodna new build unit at $196 per week is a fundamentally different financial position to a Goodna established house at $446 per week from July 2027. Both are in the same suburb. The scenario, not the suburb, is the most important variable in the Ipswich investment decision in 2026. Confirm your specific tax position with your accountant before proceeding with any purchase.
All suburb data: realestate.com.au Greater Region dataset, median price snapshot June 2025 to May 2026, verified May 2026. Figures may vary depending on data provider and geographic scope. Suburb medians: Springfield Lakes house $920,500 (+15.9%), unit $735,000 (+20.5%); Ripley house $875,000 (+15.5%), unit $730,000 (+31.5%); Redbank Plains house $825,500 (+17.9%), unit $659,000 (+14.8%); Goodna house $770,000 (+18.1%), unit $580,000 (+25.4%). Ipswich LGA house median $813,500 (+3.3%), unit $443,500 (-7.1%) , unit figure based on 6 sales June 2025 to May 2026 per realestate.com.au. Thin sample , treat with caution. Rent figures: realestate.com.au May 2026. Mortgage calculations: 5.91% p.a. investor variable rate, 30-year P&I, 80% LVR. Stamp duty: Queensland Office of State Revenue investment property rates. Ownership costs: management 8.5% of gross rent, body corporate $3,000/yr (units), council rates $3,200/yr (houses), $2,700/yr (units), insurance $2,500/yr (houses), $2,000/yr (units), maintenance 0.5% of price (established), 0.2% (new build). Depreciation: established properties Division 43 only at 2.5% of estimated construction component (40% houses, 30% units). New build: Division 43 plus Division 40 estimate. All depreciation figures are illustrative , commission a licensed quantity surveyor for your specific property. Post-budget ring-fencing: established properties purchased after 12 May 2026, negative gearing losses ring-fenced from 1 July 2027 under announced policy settings. New builds retain full deductibility under announced policy. Confirm current legislative position with your accountant. All figures are indicative. This article does not constitute financial, tax or investment advice. Always consult a licensed financial adviser, mortgage broker and registered tax agent before making investment decisions.